Correct zone
The identified SIGSA must match the later seismic activity or major earthquake location.
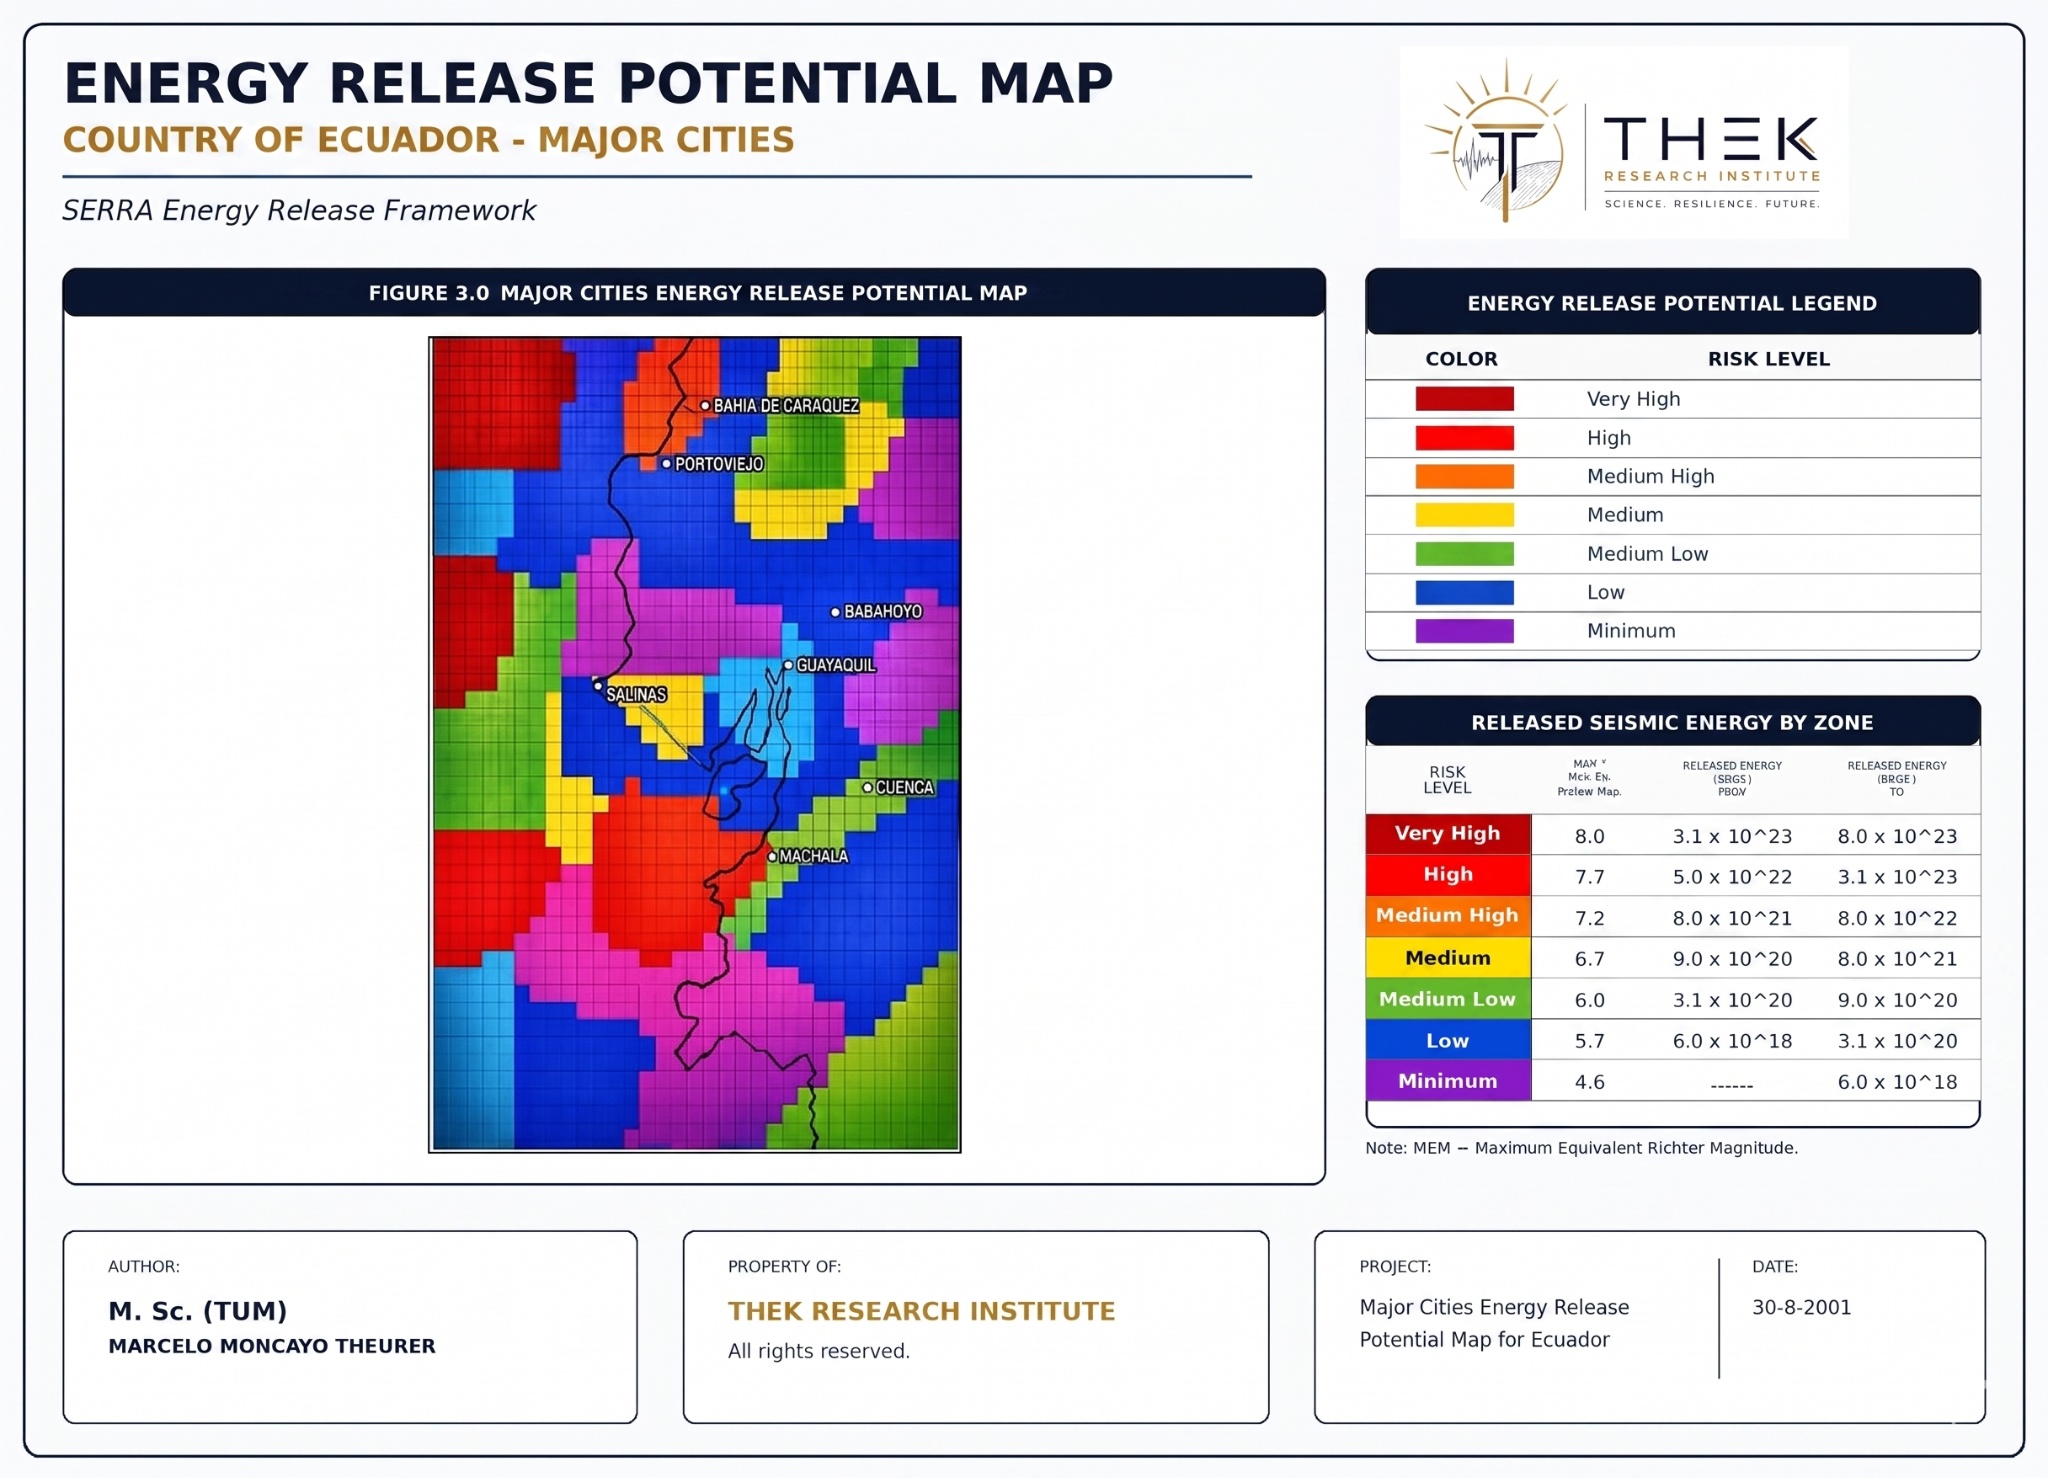
The validation page presents the evidence chain linking SERRA/MEL, the 2001 reactivation warning, the 2005 ESPOL map, the 2015 technical presentation and the Mw 7.8 Pedernales earthquake in 2016.
The validation does not claim exact earthquake prediction. It evaluates whether prospective assertions formulated before later events corresponded with observed reality in the correct geographic zone, the correct magnitude range and the correct reactivation stage.
The identified SIGSA must match the later seismic activity or major earthquake location.
The expected magnitude or energy class must be compatible with the observed event.
The event should occur within the reactivation window or seismic stage identified by the framework.
| Year | Document / event | SERRA relevance |
|---|---|---|
| 1999–2000 | Development of SERRA/MEL | Energy-based method developed in the context of earthquake engineering research in Japan. |
| 2001 | Public communication in Ecuador | Announcement of a new seismic reactivation stage beginning around year 2000. |
| 2003–2005 | ESPOL Energy Release Potential Map | Identification of key SIGSAs, including Manabí–Esmeraldas as a major threat zone. |
| 2015 | International Seismic Engineering Congress | Technical presentation of the threat before the Pedernales earthquake. |
| 2016 | Pedernales earthquake Mw 7.8 | Major empirical corroboration: zone, magnitude and reactivation stage matched the SERRA assessment. |
The ESPOL 2005 SERRA map classified the Manabí–Esmeraldas source as a very high-energy threat. The April 16, 2016 Pedernales earthquake occurred in the corresponding coastal region with Mw 7.8, matching the expected high-magnitude range associated with that SIGSA.
The validation study frames this as a triple correspondence: correct zone, correct magnitude range and correct seismic stage.
| SIGSA / assertion | Prospective range | Status |
|---|---|---|
| Manabí–Esmeraldas | Mw 7.7–8.2, northern coast | Corroborated by Pedernales Mw 7.8, 2016. |
| Chongón–Colonche | Mw 6.5–7.0, Santa Elena / near Guayaquil | Corroborated by multiple M6-class events between 2000 and 2011. |
| Jambelí | Mw 7.5–7.7, eastern Ecuadorian zone | Concordant with events 6.1, 6.8 and 7.1 between 2005 and 2010. |
| Near Guayaquil | Approximately Mw 6 near the city | Concordant with a later M5.5-class event near Naranjal. |
| Guayaquil south / Gulf–Tumbes | Mw 7.2–7.5 | Active / pending according to the validation document. |
| Subduction zone | Mw 8.3+ | Active / pending; highest-priority national threat in the SERRA interpretation. |
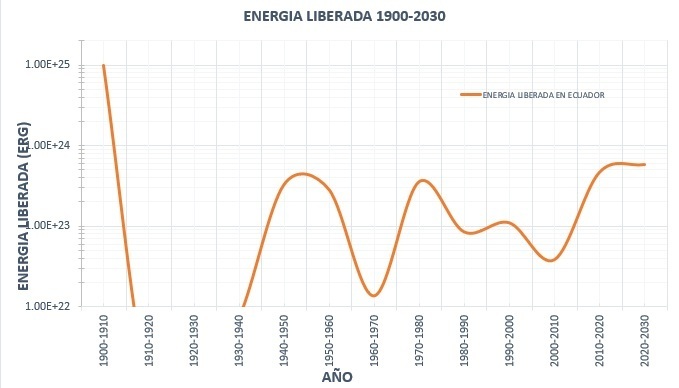
The validation report argues that the post-2000 period shows a major increase in released seismic energy across Ecuador, consistent with the reactivation stage identified publicly at the beginning of the century.
This makes SERRA not only a mapping tool, but a historical monitoring framework: it compares the present energetic state of a region against its own long-term seismic behavior.
THEK can present the evidence chain, maps, documents and validation logic for universities, municipalities, engineering organizations and risk authorities.